
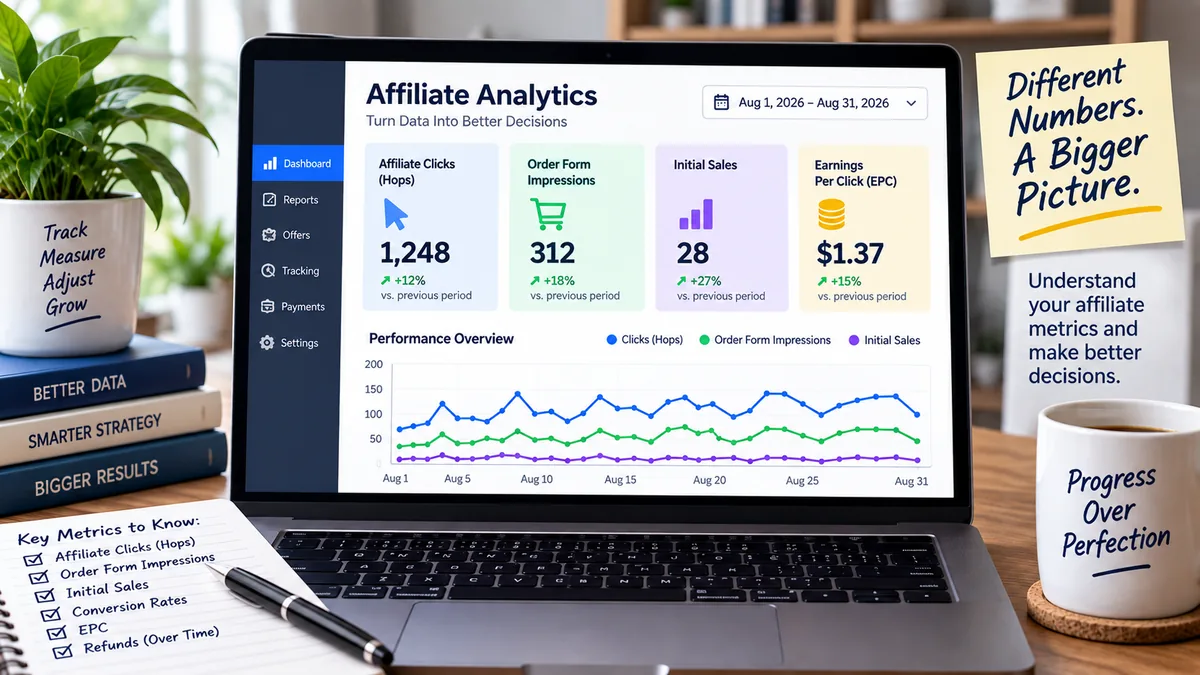
Affiliate dashboards can look intimidating when every number seems important. Learn which affiliate network metrics matter, what they actually tell you, and how to read them without overreacting to small samples.
Affiliate dashboards can become overwhelming very quickly.
You log in expecting to answer one simple question — “How is my campaign doing?” — and instead you see clicks, impressions, sales, conversion rates, earnings, tracking IDs, EPC, refunds, and several other numbers competing for your attention.
The solution is not to memorize every statistic.
The better approach is to understand what the main affiliate network metrics represent and then read them in the order a customer moves through the buying process.
For most beginner campaigns, you are really trying to understand four things:
Once you organize the numbers around those questions, an affiliate dashboard becomes much easier to use.
If you need the broader tracking framework first, read How to Track Affiliate Marketing Without Overcomplicating It.
The easiest mistake is looking at every number independently.
Instead, think about the path a visitor takes.
A simplified version might look like this:
Your traffic → affiliate link click → seller’s page → order form → sale
Your affiliate network records different events along that path.
Those events help you identify where people are continuing and where they may be dropping away.
Different affiliate networks use different terminology, so you should always check the documentation for the network you are actually using.
ClickBank, for example, calls a visitor sent through an affiliate link a Hop. Its Sales Analytics reports also include order-form impressions, initial sales, conversion rates, earnings, and EPC.
ClickBank explains these fields in its official Sales Analytics Report documentation.
The first number to understand is usually the amount of traffic that actually reached the affiliate offer through your tracking link.
On ClickBank, that event is called a Hop.
A Hop tells you that someone followed your affiliate link.
That is useful because it separates general website traffic from people who actually took the next step toward the offer.
Suppose an article receives 500 visits but only 12 people click your affiliate link.
That suggests a different situation from an article that receives 500 visits and produces 150 affiliate clicks.
The sale count might still be zero in both cases, but the first problem appears much earlier in the journey.
The first article may have a weak call-to-action, poor offer alignment, or readers who are simply not interested in moving farther.
This is why looking only at sales can hide useful information.
The next useful signal is whether visitors reached the seller’s order form.
ClickBank reports this as an initial order form impression.
This matters because a visitor who reaches checkout has moved farther than someone who merely clicked your affiliate link.
Imagine that you generate many Hops but very few order form impressions.
That can tell you that people are reaching the seller’s side of the funnel but relatively few are progressing toward checkout.
You should not immediately assume you know why.
The explanation could involve the traffic source, the match between your recommendation and the offer, the seller’s sales page, pricing, buyer readiness, or simply an insufficient amount of data.
The metric helps you locate the stage worth investigating.
It does not diagnose the cause by itself.
Sales are usually the metric people look at first.
They are important, but they make more sense when viewed alongside the earlier stages.
A campaign with 10 affiliate clicks and one sale tells a very different story from a campaign with 1,000 clicks and one sale.
The sale count is the same.
The context is completely different.
This is why affiliate reporting should be read as a connected system instead of a collection of isolated totals.
On ClickBank, the Sales Analytics report includes initial sales as well as associated earnings information.
Its separate Transaction Report provides transaction-level details and is available to affiliates as well as sellers, although the available fields differ by role.
A conversion rate turns two numbers into a relationship.
On ClickBank, Hop Conversion Rate measures initial sales relative to Hops.
Instead of asking only, “How many sales did I get?” you are asking:
How often did affiliate-link traffic become an initial sale?
That makes comparisons easier when campaigns have different amounts of traffic.
For example, consider these completely hypothetical campaigns:
Both generated two sales.
But the relationship between traffic and sales is very different.
That does not automatically prove Campaign A is the better campaign.
You would still need to consider traffic cost, traffic quality, earnings, sample size, and other factors.
Conversion rate gives you useful context rather than a final verdict.
Do not confuse affiliate-link conversion with order-form conversion.
They measure different portions of the journey.
ClickBank’s Sales Analytics includes a conversion rate based on sales relative to order form impressions.
That tells you what happened after people reached checkout.
For example, if many visitors reach the order form but few purchase, that is a different pattern from a campaign where hardly anyone reaches the order form in the first place.
Again, the metric points you toward a stage.
It does not automatically tell you exactly what caused the result.
There is an important reporting detail to understand if you use ClickBank.
ClickBank added unique event counts such as Unique Hops and Unique Order Form Impressions to its Reporting Suite.
Its current conversion-rate calculations use unique-event data rather than simply counting every repeated click or order-form impression as another person.
This helps reduce distortion when the same visitor generates the same event more than once.
ClickBank explains the change in its official unique-event reporting documentation.
For a beginner, the practical takeaway is simple:
Know whether the metric you are reading represents events, unique people, or a conversion rate calculated from unique events.
That distinction can matter when you compare reports.
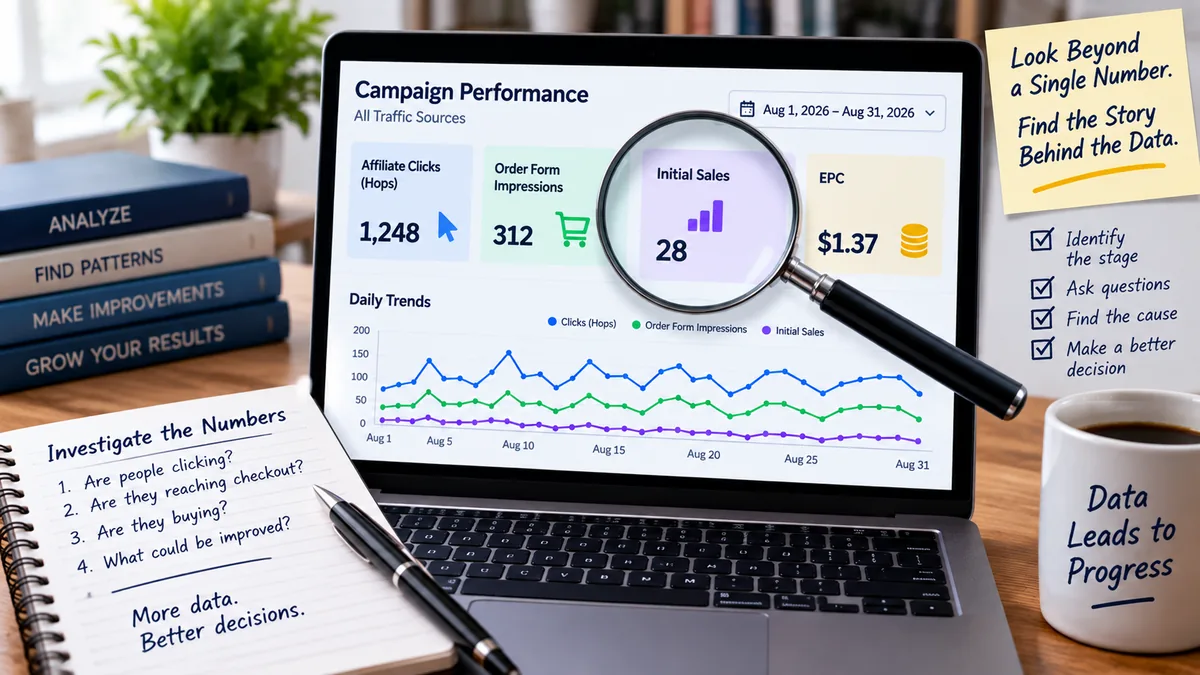
EPC stands for Earnings Per Click.
On ClickBank, Affiliate EPC represents affiliate earnings generated per Hop.
EPC can be useful because it combines traffic and earnings into one efficiency metric.
But beginners sometimes give EPC more power than it deserves.
An EPC number is not a promise that your next click will earn that amount.
It is a calculated average based on the activity included in the report.
Your own EPC can vary based on factors such as:
Use EPC as a comparison and diagnostic metric, not as a prediction of what every visitor is worth.
Affiliate earnings and business profit are not the same thing.
If you spend $200 on advertising and generate $150 in affiliate earnings, seeing $150 in the network dashboard does not mean the campaign produced $150 in profit.
You still have to consider what it cost to create those results.
That can include advertising spend and, depending on how deeply you are analyzing the business, other operating costs.
This becomes especially important when comparing paid traffic campaigns.
A campaign generating more sales can still be less attractive than another campaign if acquiring those sales costs substantially more.
A reported sale is not always the final economic result.
Depending on the affiliate network and offer, transactions may later be refunded or charged back.
That means you should avoid judging an offer only from the excitement of seeing an initial sale.
As your data grows, pay attention to the quality and durability of those transactions as well.
If an offer generates impressive initial activity but consistently produces poor downstream results, that information matters when deciding whether the offer deserves more traffic.
This is another reason to evaluate offers based on more than commission size. The process in How to Choose an Affiliate Offer Without Chasing High Commissions starts with audience fit rather than payout alone.
A network report becomes much more useful when you can tell which traffic created the numbers.
If several articles, advertisements, emails, and traffic sources all use the exact same unsegmented affiliate link, you may know that sales occurred without knowing which campaign deserves credit.
Tracking identifiers can help separate that activity.
ClickBank supports affiliate tracking parameters that can be viewed in its reporting, giving affiliates additional ways to distinguish campaign activity.
You can review the available options in ClickBank’s official Affiliate Tracking Parameters documentation.
Do not create a naming system so complicated that you cannot remember what the codes mean.
A simple, consistent structure is usually better.
You might distinguish traffic by source, campaign, article, or creative when that distinction will actually help you make a decision later.
When a campaign is not producing the result you expected, read the numbers from the beginning of the journey rather than jumping straight to earnings.
A useful diagnostic order is:
This order helps you identify where the funnel changed instead of simply declaring that an offer “works” or “doesn’t work.”
It also connects directly with the simple funnel structure in How to Build a Simple Affiliate Marketing Funnel for Beginners.
Imagine a hypothetical campaign generates:
Do not begin by declaring three sales good or bad.
Instead, ask questions.
Did 300 affiliate clicks require 500 website visitors or 50,000?
Were the clicks free organic traffic or expensive paid traffic?
Is 45 order form impressions consistent with what you normally see from that offer?
Were the three sales concentrated in one traffic source or spread across several?
How much did the campaign earn?
How much did the traffic cost?
Did refunds later change the result?
Metrics become useful when they generate better questions.
They become dangerous when a single number is treated as the entire story.

One sale from ten clicks can feel extremely encouraging.
Zero sales from ten clicks can feel extremely discouraging.
Neither sample tells you very much by itself.
Small samples are noisy.
A few individual visitors can dramatically change conversion rates, EPC, and other averages.
That does not mean you should ignore early data.
It means you should treat early data as information rather than certainty.
Look for patterns as the sample grows.
When you are testing paid traffic, this also prevents you from constantly changing campaigns before they have had a reasonable opportunity to produce useful information.
If affiliate clicks are weak, work on the part of the funnel that creates affiliate clicks.
If people click but rarely move toward checkout, investigate the match between the traffic, your content, and the offer.
If checkout traffic exists but purchases remain weak, the issue is happening farther downstream.
If sales occur but the economics are poor, look at costs, earnings, and campaign efficiency.
Changing the headline, traffic source, bridge page, affiliate offer, advertisement, and email sequence simultaneously makes it difficult to learn which change mattered.
Change one meaningful variable when possible, observe what happens, and keep a record.
The purpose of affiliate reporting is not to give you another screen to refresh every ten minutes.
It is to help you make better decisions.
You do not need to become an analyst before you can understand affiliate network metrics.
Start with the visitor journey.
Look at traffic and affiliate clicks first.
Then see whether people progressed toward checkout.
Look at sales in context.
Use conversion rates and EPC to compare activity rather than treating them as guarantees.
Separate campaigns with sensible tracking IDs when necessary.
Most importantly, give the data enough time and volume to become useful before making major conclusions.
Once you know what each number represents, the dashboard becomes much less intimidating.
It becomes a map showing you where to look next.
Subscribe to get the latest posts sent to your email.
If you found this guide helpful, please tap the Like button and share it with someone who could benefit. Every Like and Share helps more people discover Partner to Wealth.